Ansible Container usage
Greg told me at AnsibleFest that we don’t know how many users Ansible Container has. PyPI no longer directly provides information about downloads. Except… I recently stumbled upon this blog post which talks about getting download stats for PyPI packages using Google BigQuery. So let’s do that!
We need to execute a BigQuery SQL-like query. Let’s do one from the blog post mentioned above which shows daily downloads. Here’s how you can run the query yourself:
-
Just open the Google BigQuery service.
-
Enter this query:
SELECT STRFTIME_UTC_USEC(timestamp, "%Y-%m-%d") AS yyyymmdd, COUNT(*) as total_downloads, FROM TABLE_DATE_RANGE( [the-psf:pypi.downloads], DATE_ADD(CURRENT_TIMESTAMP(), -300, "day"), DATE_ADD(CURRENT_TIMESTAMP(), -1, "day") ) WHERE file.project = 'ansible-container' GROUP BY yyyymmdd ORDER BY yyyymmdd DESC -
And just run it.
You can even export it into spreadsheets afterwards. I did that and annotated the chart a bit:
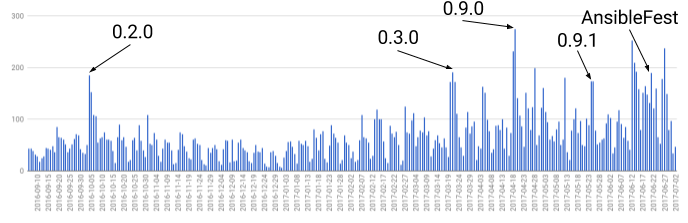
As you can see, the new release usually creates a spike. On the other hand, there is a bunch of other spikes, I assume usually caused by someone talking or writing about Ansible Container.
Overall, more and more people seem to be using Ansible Container. Can’t wait for 1.0.
Here’s some more links related to download stats: