Prometheus counters don't behave
…when the numbers are not increasing consistently.
The problem
We have moved from httpd + mod_wsgi to launch Packit’s API server with
mod_wsgi-express.
That change simplified
how we run Packit - look at the number of removed lines! But sadly it broke a
Grafana chart I used almost daily. The chart shows an
amount of traffic from GitHub webhooks Packit processes.
This chart is wrong because it should display “current load”, instead of these constantly increasing lines which reset at some point:
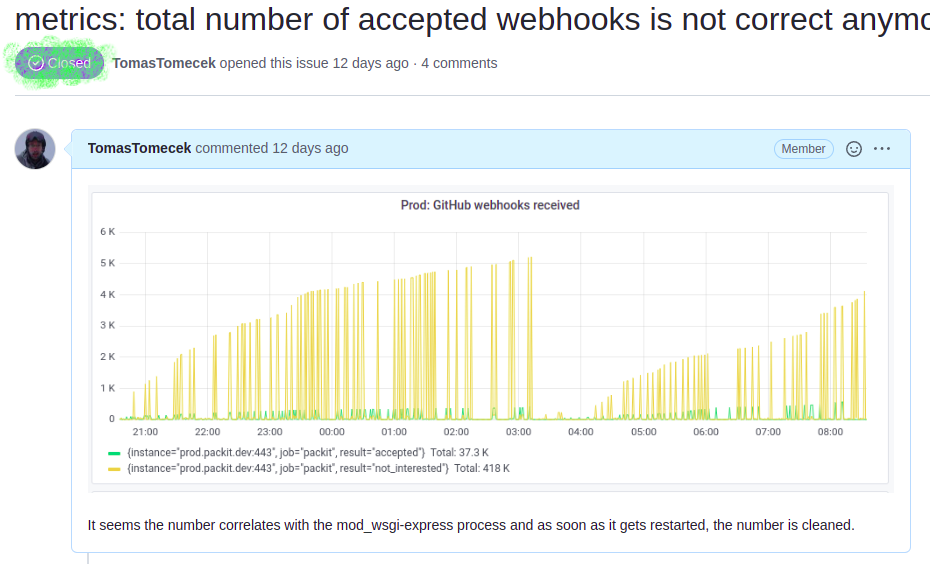
Suddenly we have this chart which doesn’t tell us anything meaningful.
Analysis
There are a few things to understand in order to resolve the problem. I learnt all of these while researching :)
-
Prometheus counters are meant to only increase or reset if the process restarts.
Hold on, but that’s happening in the chart above, so… Why it’s wrong?
-
Grafana
increase()function should be used to visualize the data since it shows a difference between measurements and hence shows the load.Well, we used it before changing the webserver and it worked as expected. So what change broke the chart?
-
The
increase()function can deal with the resets to 0. Except that based on the chart above it seems it cannot. -
Finally (and most importantly), we have a
/metricsendpoint in Packit which provides numbers for Prometheus used for the chart above. The data is stored in the Python WSGI process, the numbers are not in any database: they are just regular Python variables defined using the python prometheus client library. They are in mercy of Python, WSGI, Linux and OpenShift.
Please read here, in the original GitHub issue comment, the complete analysis of the problem with real examples.
This is just a quick blog post, so here’s the actual bug:
TL;DR the /metrics endpoint is served by multiple httpd processes which
have different numbers and they confuse the increase() function because the
numbers are no longer monotonically increasing.
Resolution
\o/
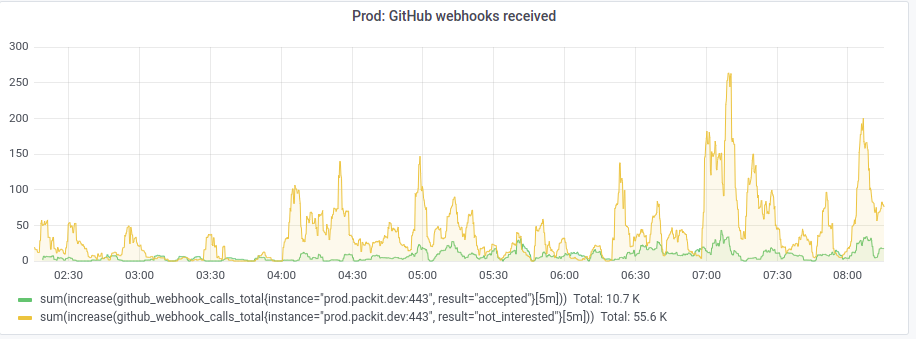
I resolved this by applying
labels to different
measurements (process ID in this case) and aggregate them with the sum()
function. You can see the updated query in the chart above, here’s a
corresponding PR.
Grafana’s not public.
Happy measuring!